https://www.tradingview.com/script/FtGxNnHd-Sentiment-TA-Starbots/
Sentiment of Technical Analysis
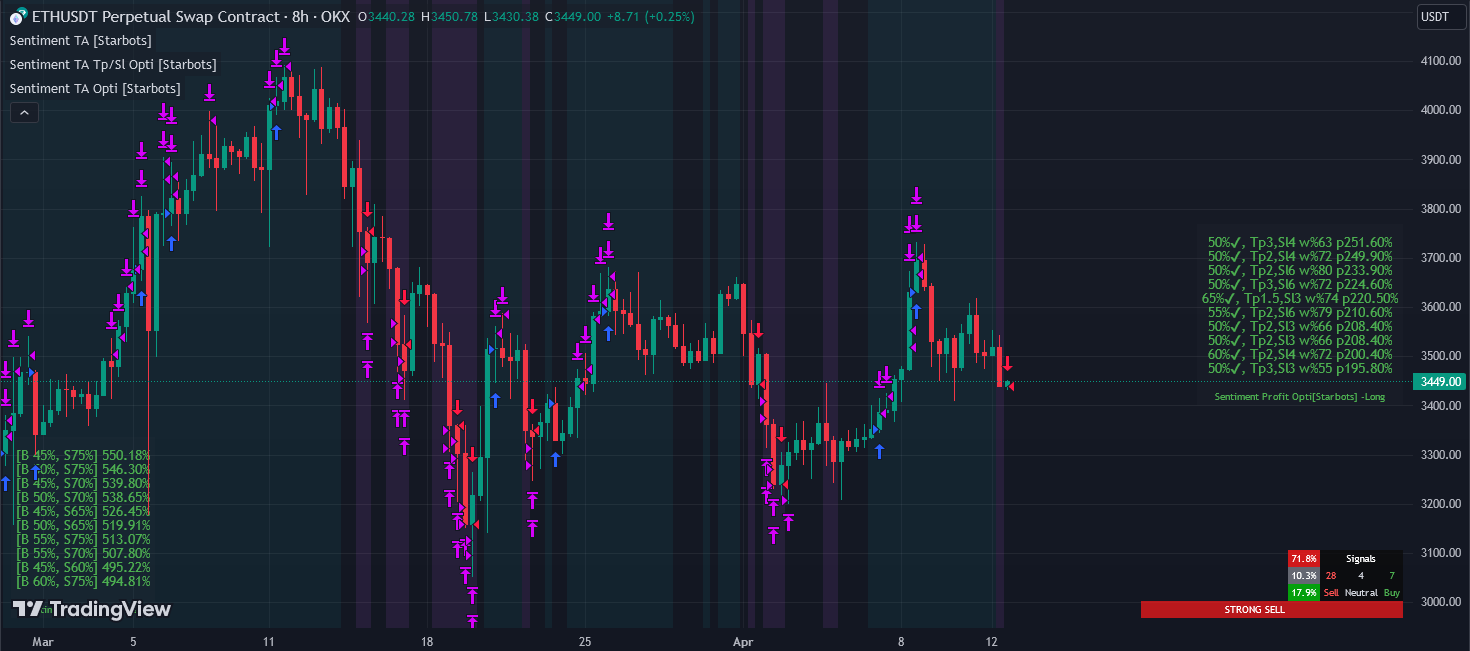
This script follows the idea of popular “Technical Analysis Summary” on Tradingview. A lot of different Exchanges and Platforms uses the same approach too. www.tradingview.com/…/BTCUSDT/technicals/
I have also coded optimizers to find profitable settings faster.
Technical Ratings can be a valuable technical analysis tool for many analysts or traders. Many traders use a selection of complementary indicators to make better decisions. Technical Ratings simplifies this task by combining the most popular indicators and their signals.
🔼Indicators Used (40 so far, adding more)
—Oscillators<17>
ROC, Aroon, On Balance Volume, STOCH RSI, Awesome Oscillator, MACD, RSI, Stoch, Williams %R, Bull Bear Power, ADX, CCI, UO, Momentum, MFI, Vortex Indicator, Andean Oscillator.
—Trend/MAs <19>
EMA(5), SMA(5), EMA(10), SMA(10), EMA(20), SMA(20), EMA(30), SMA(30), EMA(50), SMA(50), EMA(100), SMA(100), EMA(200), SMA(200), VMWA(20), HMA(9), Ichimoku Cloud(9, 26, 52, 26), Parabolic SAR(0.02,0.02,0.2), Supertrend (2,10)
—Pivots <4>
Traditional, Fibonacci, Camarilla, Woodie
Calculations
These are the criteria used to determine the rating of the individual indicators used. Note that changes from the last bar are used to determine falling or rising states. Please turn on recalculate after every tick in Properties tab, to use this strategy as indicator and see indicator working in real time – without waiting for a bar close.
All Moving Averages
Buy — MA value < price
Sell — MA value > price
Neutral — MA value = price
Ichimoku Cloud
Buy — base line < price and conversion line crosses price from below and lead line 1 > price and lead line 1 > lead line 2
Sell — base line > price and conversion line crosses price from above and lead line 1 < price and lead line 1 < lead line 2
Neutral — neither Buy nor Sell
Commodity Channel Index
Buy — indicator < -100 and rising
Sell — indicator > 100 and falling
Neutral — neither Buy nor Sell
Average Directional Index
Buy — indicator > 20 and +DI line crosses over -DI line
Sell — indicator > 20 and +DI line crosses under -DI line
Neutral — neither Buy nor Sell
Awesome Oscillator
Buy — saucer and values are greater than 0, or cross over the zero line
Sell — saucer and values are lower than 0, or cross under the zero line
Neutral — neither Buy nor Sell
Momentum
Buy — indicator values are rising
Sell — indicator values are falling
Neutral — neither Buy nor Sell
Williams Percent Range
Buy — indicator < lower band and rising
Sell — indicator > upper band and falling
Neutral — neither Buy nor Sell
Bulls and Bears Power
Buy — uptrend and BearPower < zero and BearPower is rising
Sell — downtrend and BullPower > zero and BullPower is falling
Neutral — neither Buy nor Sell
………..
The numerical value of the Sell rating is -1, Neutral is 0 and Buy is 1. The group and overall ratings are calculated as the average of the ratings of the individual indicators.
Recommendations for the group or overall ratings are based on this numerical rating value and determined according to the following criteria:
— Strong Sell
— Sell
— Neutral
— Buy
— Strong Buy
Background color is displayed for Buy or Sell based on your Buy Score input and Sell Score input value.

By using Star Bots Trading Algorithms, you agree with the terms of EULA and consent to be bound by them. You use the Trading Algorithm at your behalf and at your own risk. Star Bots is not responsibile or liable for your’s direct or indirect losses, damages, costs and expenses. You are not allowed to edit, copy, reproduce, distribute, resell, use the Trading Algorithm for signalling services, copy-trading or otherwise use the Trading Algorithm for your own or other’s interests or for any commercial purpose. If such or any other breach of EULA occur, you’re contract will be terminated immediately and you are obligated to stop all access and use of this Strategy.

